In enterprise IT, we’re fluent in the language of layers. From network to application, each stratum has its protocols and responsibilities. Tackling greenhouse gas emissions demands the same layered mindset. Too often organizations focus solely on top-level reporting or infrastructure tweaks, overlooking the “missing middle” where applications themselves can and must become carbon-aware.
Here’s how you can think about emissions management at the organizational, infrastructure, and application layers and why that middle tier may hold the biggest impact of them all.
The Organizational Layer: Compliance and Accountability
At the summit sits your corporate entity, wrestling with Scope 1, 2, and 3 emissions. This is where board-room presentations shine, annual reports land on desks, and offsets quietly fill the gaps. If you’re under pressure from regulators or investors, you’ll recognize the rituals: gathering data, aligning with GHG Protocol or CDP requirements, and publishing glossy disclosures.
But there’s a catch. Compliance alone rarely translates into real-world reductions. Internal carbon pricing can penalize departments for electricity or travel, yet seldom changes the underlying behavior. Purchasing offsets such as forest projects or carbon credits feels proactive but mostly serves as a PR shield. You end up with a clean balance sheet and the same old emissions trajectory.
If your goal is true decarbonization, organizational measures set the stage, but they don’t win the race. You need to descend one layer deeper.
The Infrastructure Layer: Hardware Efficiency and Renewables
Beneath corporate policy lives your compute environment – the humming servers, the racks, and data centers. Here, you have more direct control. Start by choosing data centers with low Power Usage Effectiveness (PUE), deploying liquid cooling, or even reclaiming and reusing hardware components. Some cloud providers now publish real-time grid carbon intensity, letting you align workloads with cleaner energy windows.
For example, batch processing jobs scheduled during peak solar or wind generation can reduce data center emissions by double digits. Power purchase agreements and on-site renewable power generation further decouple your growth from the grid’s dirty hours.
Yet real-time constraints often bite. Mission-critical applications can’t pause until the wind picks up. And while infrastructure improvements drive meaningful savings, they can’t touch the hundreds of millions of inference requests and user transactions running through your application layer each day.
What’s more, is that over 90% of organization utilize technology they don’t control. SaaS solutions like Salesforce Sales Cloud or Microsoft Dynamics 365 live in the cloud, which means end users can’t directly measure how much energy servers consume and how much GHG are being emitted. Same applies to PaaS tools like Power BI, Informatica, Zapier, and many more. How can we assess environmental impact from individual systems that we do not control?
The Application Layer: The Missing Middle
The answer is in Carbon-Aware Application Portfolio. Unfortunately, this is where most conversations derail and where the greatest opportunity lies. Imagine an application that senses grid carbon intensity and gracefully shifts into an eco-mode during high-carbon periods. Or microservices dynamically routing requests to regions with cleaner electricity. These aren’t futuristic fantasies; they’re emerging best practices in carbon-aware application management.
Consider demand shaping. A customer-facing analytics dashboard might switch from real-time to batch updates when emissions spike, cutting its footprint without disrupting the user experience. Geo-shifting can route resource-heavy processes like video encoding to greener grids overseas. Some teams have reported emission reductions of 20-25% simply by rerouting workloads.
Then there’s the integration of carbon budgets into CI/CD pipelines. Before a new release goes live, automated gates check whether its projected emissions exceed the team’s monthly allocation. If the code overshoots, the build fails and engineers are challenged to optimize loops or trim dependencies. The result is leaner features and a constant feedback loop on environmental impact.
Real-time emission dashboards complement these practices. By tracking CO₂ per request alongside latency and error metrics, product managers gain an immediate sense of the environmental cost of new features. Spotting a heavy-weight AI model that adds five extra grams of CO₂ per session can prompt a switch to a distilled alternative, saving thousands of kilograms of emissions over time.
Putting this all Together
If you’ve ever configured a network stack, the analogy becomes obvious. Just as the OSI model separates physical, transport, and application concerns, a layered carbon strategy clarifies roles:
- Organizational Layer sets policy and accountability, akin to governance in OSI’s highest tiers.
- Infrastructure Layer optimizes physical resources, mirroring OSI’s network and data-link planes.
- Application Layer orchestrates carbon-aware logic, much like the session and application layers manage end-to-end communication.
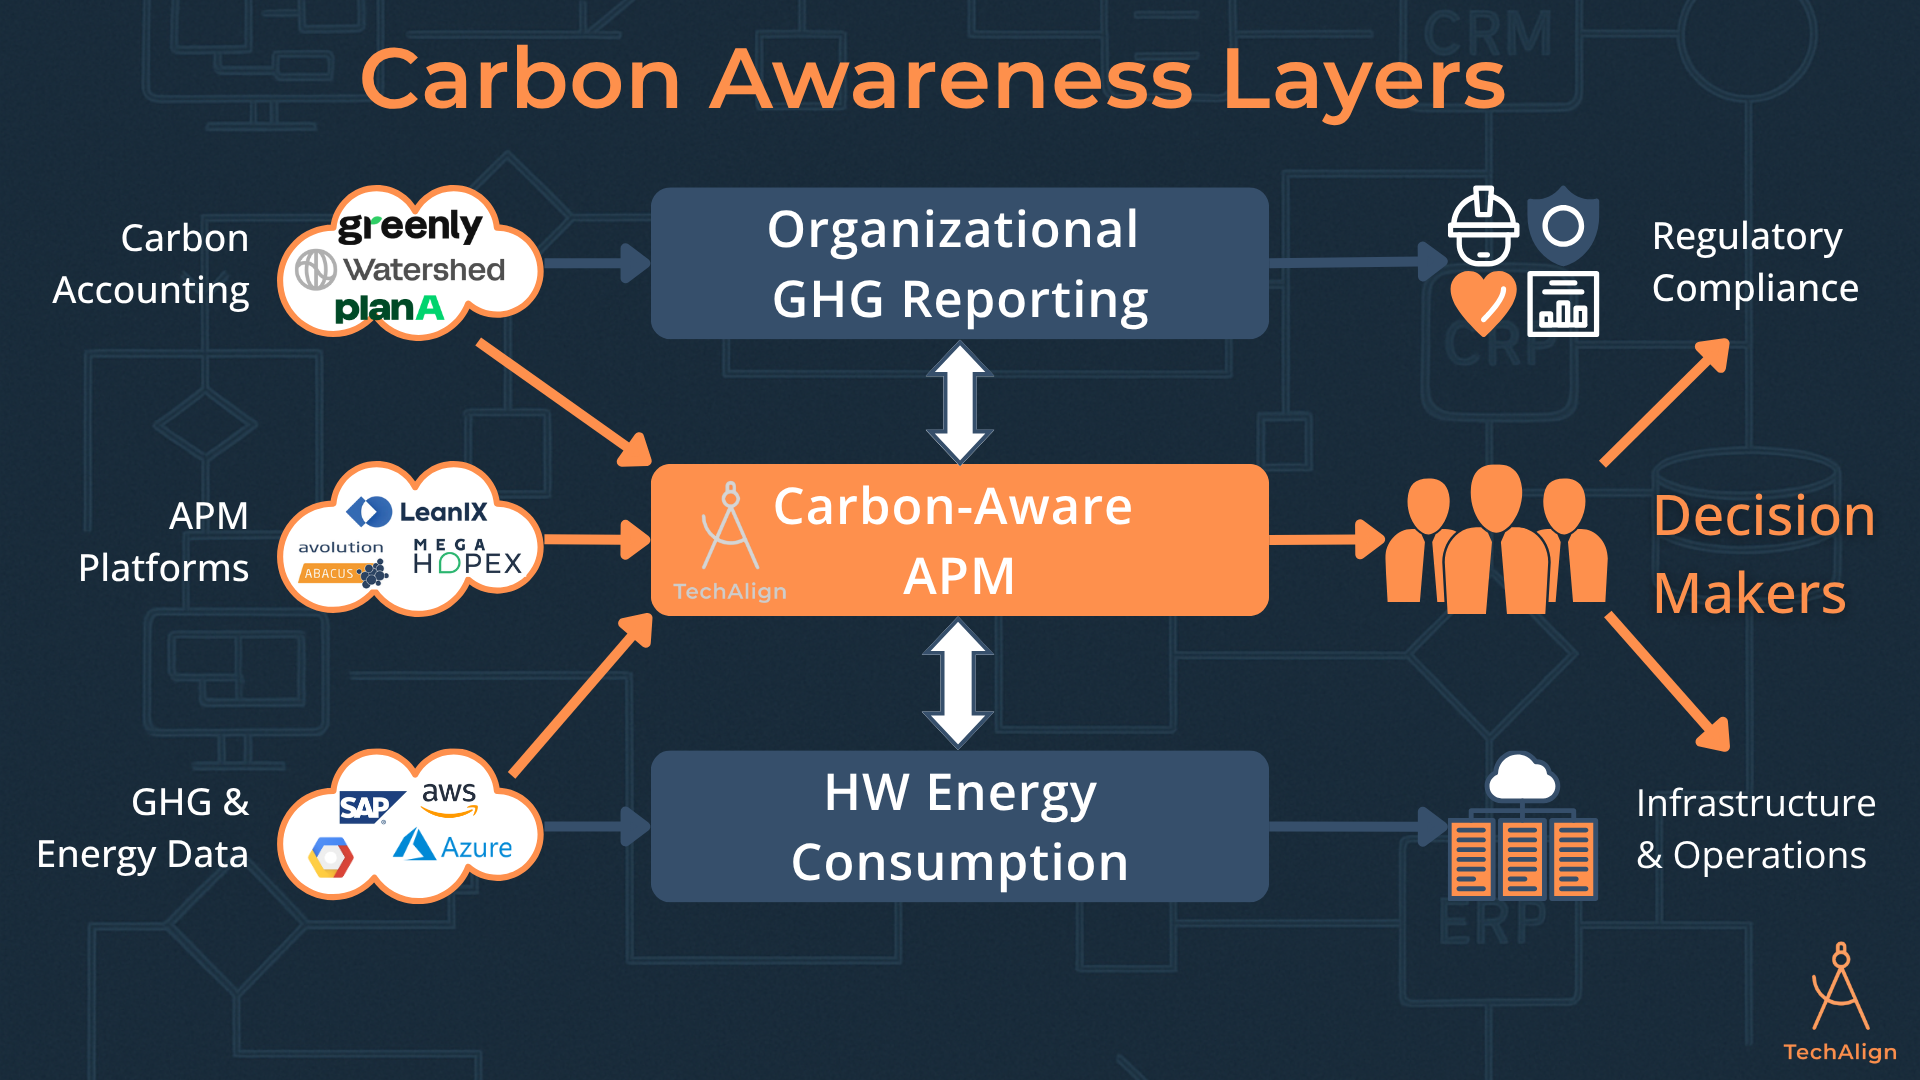
While currently there are multiple choices in Carbon Accounting platforms like Greenly | Certified B Corp, Watershed, Plan A, Normative.io, and many others; they only paint part of the picture, mostly useful for the Organizational Layer.
In parallel, data centers now report PUE, demonstrate their energy and water consumption efficiency, and provide detailed reports on actual emissions. Cloud providers are starting to do that too. All of this can be used to reduce your GHG footprint at infrastructure level.
The real challenge in assessing your real application and platform emissions impact stems from the complexity of modern solutions. Tools may store some data in a Cloud Database, process logic using Lambda Functions, and pipe data into a reporting SaaS platform. This is where Carbon-Aware Application Portfolio Management (CAPM) comes to the rescue.
Merging Traditional APM with Carbon Management
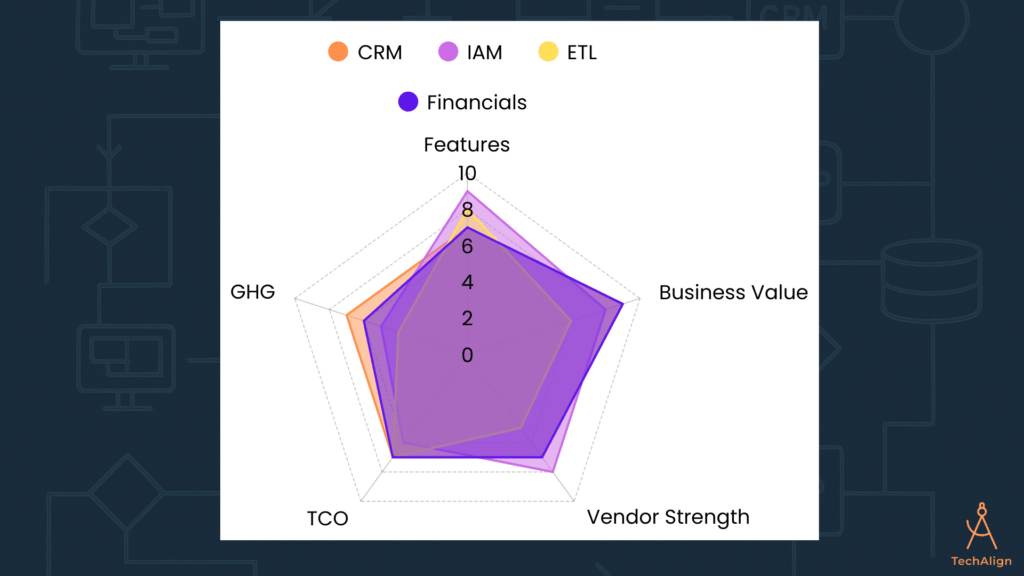
Many popular APM platforms like SAP LeanIX, Avolution, or Bizzdesign provide powerful tools to assess each application based on Total Cost of Ownership, Alignment with Business Strategy, and Technical Fit. What they are missing is how much GHG each tool generates.
TechAlign Solutions is spearheading this effort by integrating emissions data from Carbon Accounting tools, Cloud Providers raw data, and 3rd Party GHG reporting datasets into APM platforms. This combination of TCO, Business Value, Technology, and Carbon Metrics allows decision makers to assess which tools to keep and which may need to be replaced or retooled.
Conclusion
Managing GHG is not a one-dimensional challenge. It demands a structured approach, with clear roles and tools at the organizational, infrastructure, and application levels. Skipping the application layer is like cutting out the session layer in an OSI stack – your system might still function, but it loses critical intelligence and control.
By treating carbon management as a full-stack problem, you not only meet compliance and efficiency goals but also unlock a new frontier of sustainability. And in a world racing toward net-zero, that may well be the game-changer your enterprise needs.